SEC Rule 605(a) Reports
SEC Rule 605 Summary Report – Fact Sheet
This fact sheet broadly explains SEC Rule 605, and specifically, the Summary Report which requires broker-dealers and market centers to publish standardized reports on order execution quality. Rule 605 is designed to enhance transparency and help investors compare how effectively different firms execute trades.
The document defines key terms such as National Best Bid and Offer (NBBO), order types, and order size categories. It also explains the core metrics used to evaluate execution quality, including price improvement, execution speed, and trading costs.
These insights help investors better understand how their orders are handled and enable more informed comparisons across market participants.
SEC Rule 605 Summary Report – Visual Guide
These diagrams provide step-by-step illustrations of how key SEC Rule 605 Summary Report metrics are calculated using real-world trading examples. They walk through the core building blocks of execution quality analysis—starting with basic inputs like bid/ask prices and order details—and show how those inputs translate into standardized metrics.
The visuals cover calculations for notional order size, quoted spread, and midpoint, as well as performance measures such as price improvement, effective spread, realized spread, and execution speed. Each example demonstrates how trade prices compare to the National Best Bid and Offer (NBBO) and how those differences are expressed as percentages or time-based measures.
Together, these diagrams are designed to make complex execution quality calculations more intuitive, helping readers understand how Rule 605 metrics quantify trading costs, price improvement, and overall execution performance.
The Securities and Exchange Commission (“SEC”) has adopted rules requiring market centers and larger
customer-facing broker-dealers (collectively “market participants”) to provide standardized execution quality
reports to the public. The intent is to improve transparency to investors and increase competition among market
participants by allowing investors to compare average order execution quality.
The rule requires the monthly production and public display of two reports:
- Detailed Report [Rule 605(a)(1)]: It is in machine-readable format and
includes low-level groupings, including at the stock-level.
- Summary Report [Rule 605(a)(2)]: It is intended to be human-readable and
contains higher-level groupings.
The reports contain both execution quality statistics and descriptive statistics to compare the executions and
order flow characteristics of market participants.
Terms to Know
National Best Bid
The National Best Bid is the highest displayed round lot price available for sell orders to immediately trade
against. It is a composite of all national securities exchanges’ quotes.
National Best Offer
The National Best Offer is the lowest displayed round lot price available for buy orders to immediately trade
against. It is a composite of all national securities exchanges’ quotes.
Round Lot
A round lot is the minimum share size eligible to be included in the National Best Bid or National Best Offer.
This size is based on the price of the security, with higher priced securities having a lower round lot size
than lower priced securities.
Rule 605(a) Summary Report Groups
The Summary Report includes columns for stock index, order type, and order size group combinations to allow for a
nuanced look at execution quality statistics.
S&P 500 Flag
What it is: A value showing whether the orders included in the calculations for
the respective row are on stocks within the S&P 500 index, with “Y” for “Yes” and “N” for “No”.
Order Type
What it is: A value showing whether the orders included in the calculations for
the respective row are “market orders” or “marketable limit orders”, with “M” for market orders and “MLIMIT” for
marketable limit orders.
- A market order is an order to buy or sell a stock at the current market
price. Market orders typically fill immediately at the best available price when entered during market
hours.
- A marketable limit order is an order to buy with a limit price at or above
the National Best Offer or an order to sell with a limit price at or below the National Best Bid. Depending
on market conditions, a marketable limit order may fill immediately in its entirely, fill partially, or not
fill at all.
Order Size (USD)
What it is: A value showing one of nine notional order size categories. There
are eight possible non-overlapping order size categories and one summary order size category containing all
orders less than $200,000 in value.
Rule 605(a) Summary Report Metrics
The Summary Report includes both descriptive statistics (e.g., Average Order Size) and execution quality
statistics (e.g., Average Effective Spread / Average Quoted Spread %) to aid in the comparison of market
participants.
Average Order Size (Shares)
- What it is: A measurement of the average customer order size sent to the
broker-dealer.
- How it’s calculated: For both market and marketable limit orders, average
order size in shares is calculated as the sum of shares ordered divided by the sum of orders.
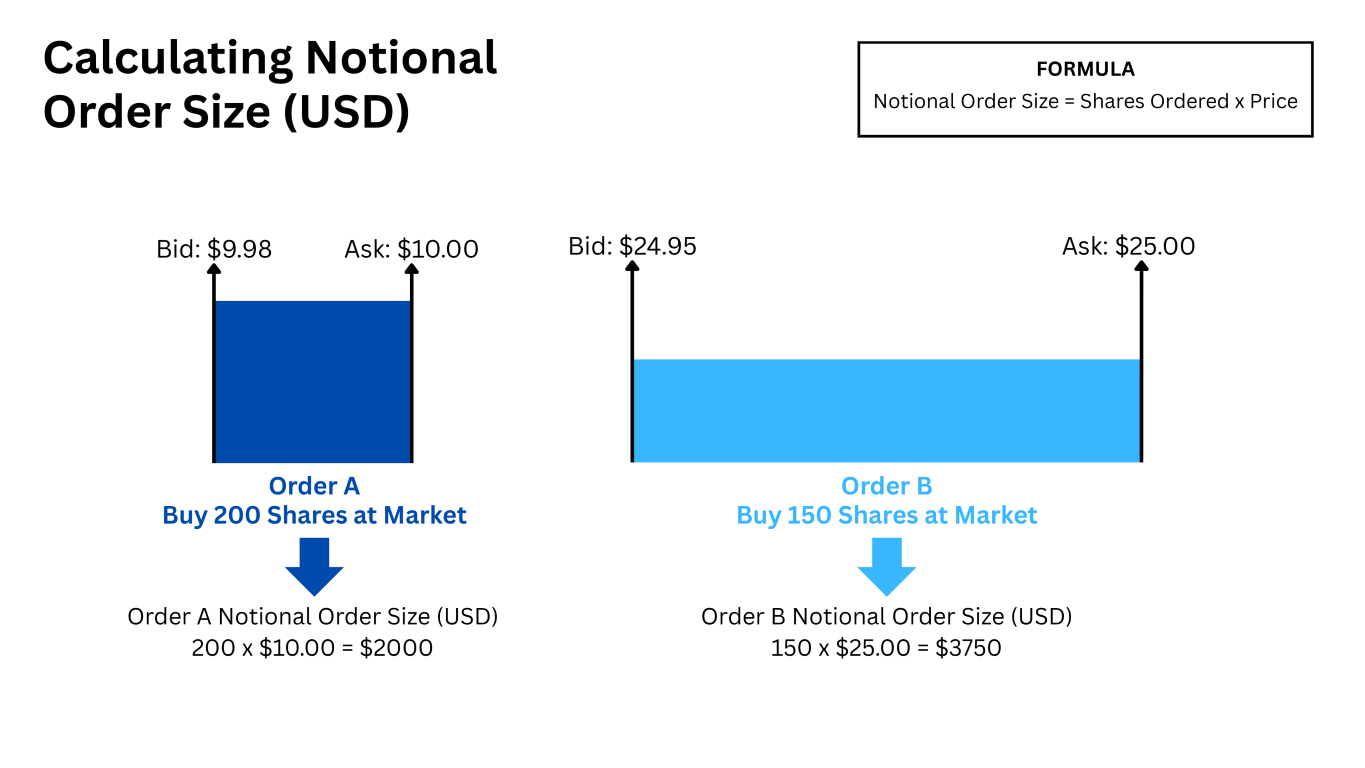
Average Notional Order Size (USD)
- What it is: A measurement of the average customer order size sent to the
broker-dealer.
- How it’s calculated: For limit orders, the notional value is calculated by
multiplying the number of shares by the order’s limit price. For market orders to buy, the notional value is
calculated by multiplying the number of shares by the National Best Offer at the time of order entry; for
market orders to sell, the notional value is calculated by multiplying the number of shares by the National
Best Bid at the time of order entry. The notional value of each order is aggregated into a simple average.
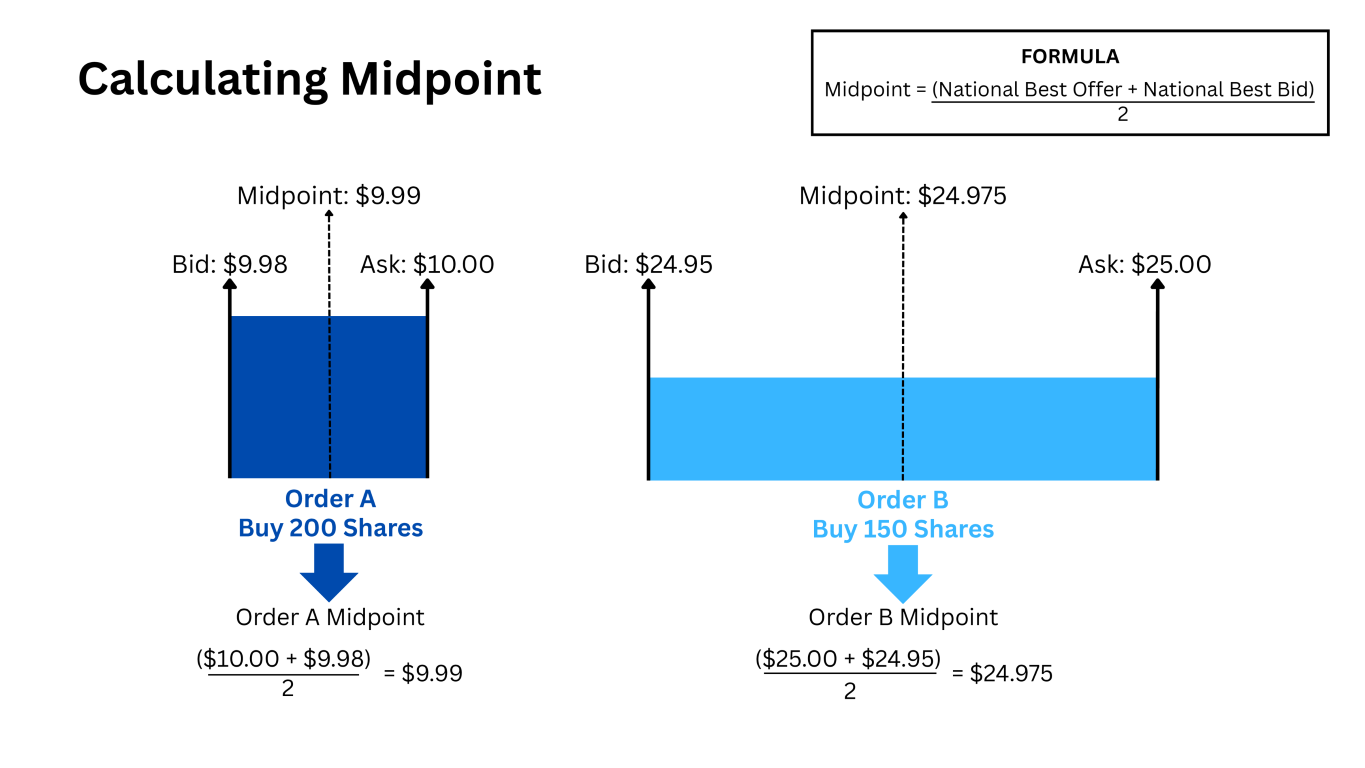
Share-weighted Average Midpoint
- What it is: A measurement of the average share price on orders sent to the
broker-dealer.
- How it’s calculated: For both market and marketable limit orders, the
midpoint is calculated as the average of the National Best Offer and National Best Bid at the time of order
entry. The average midpoint of each order is aggregated by shares.
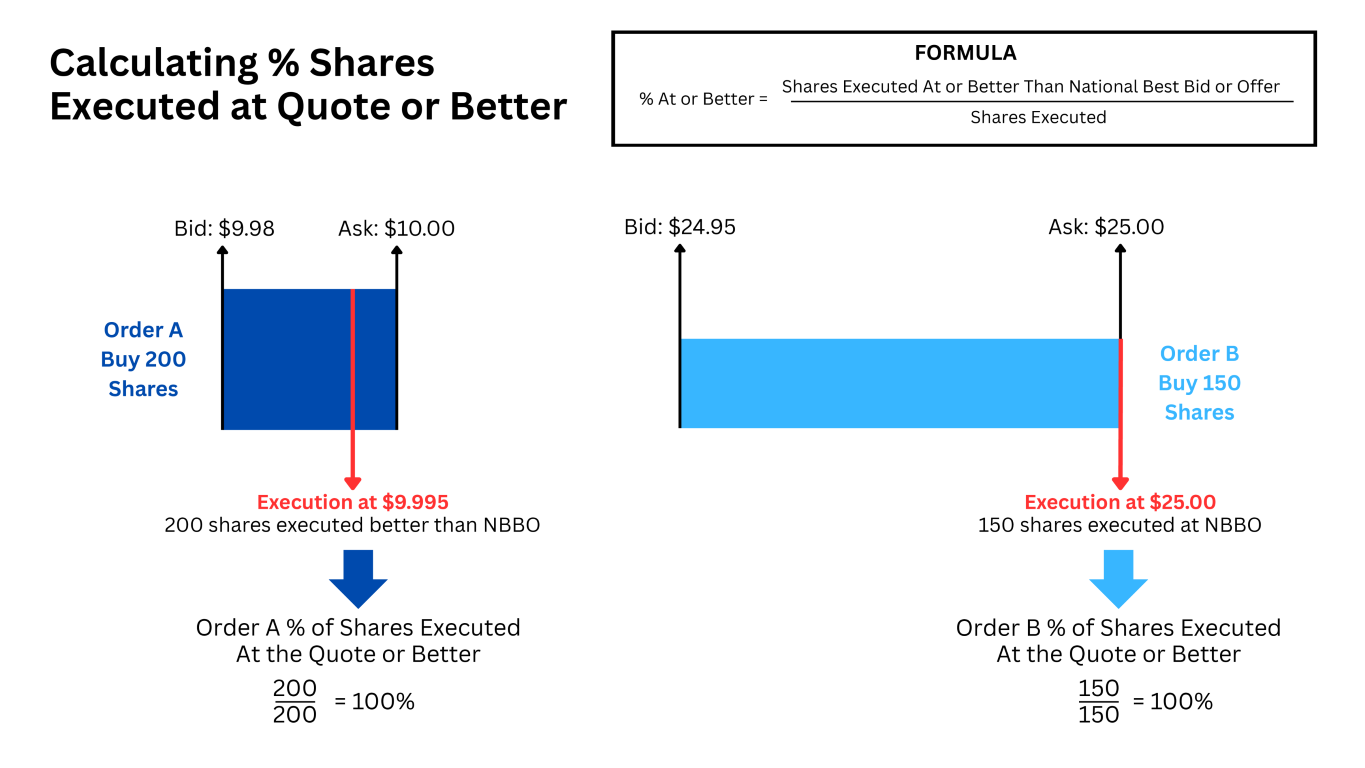
% Shares Executed at Quote or Better
- What it is: A measurement of the frequency of shares receiving the quoted
price or better on orders sent to the broker-dealer.
- How it’s calculated: For buy orders, shares executed at the quote or better
are those with a price the same or below the National Best Offer; for sell orders, shares executed at the
quote or better are those with a price the same or above the National Best Bid. The sum of shares executed
at the quote or better is divided by the sum of all executed shares from the same orders.
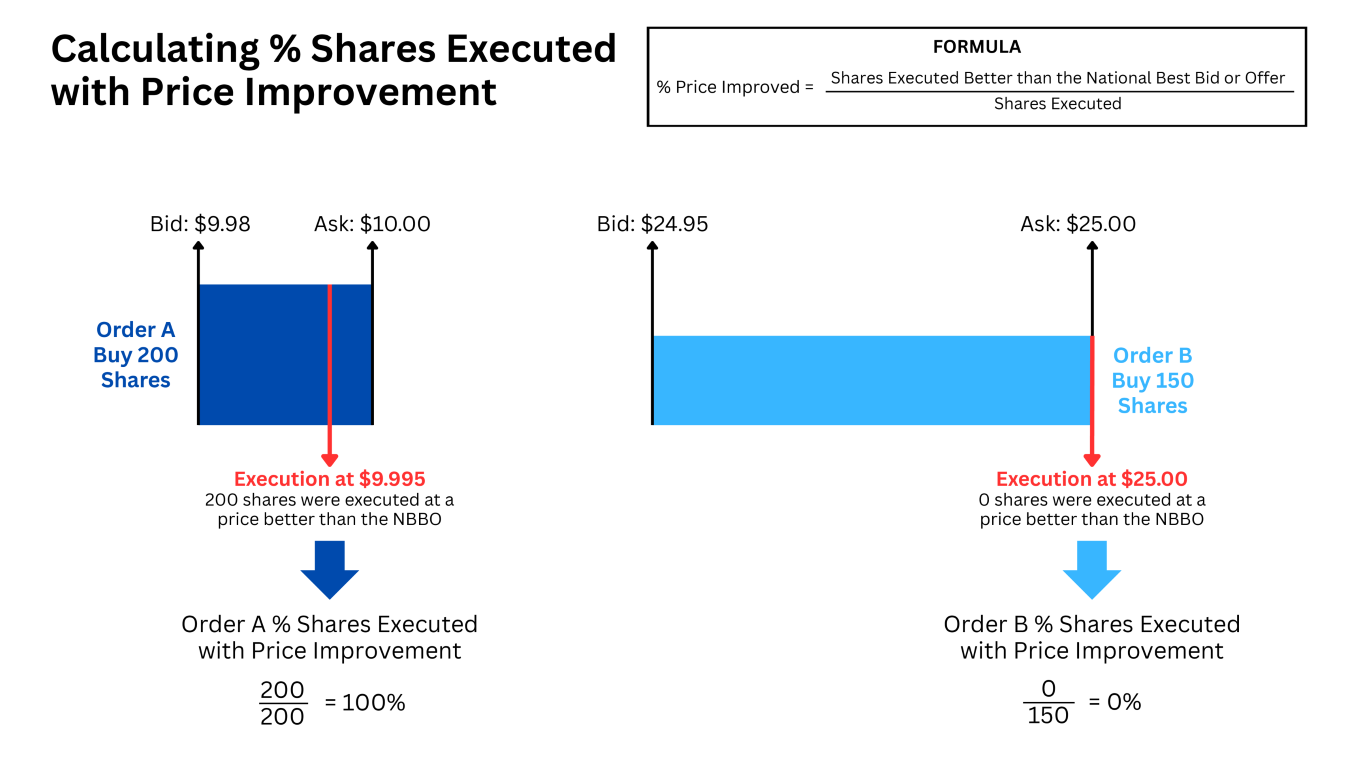
% Shares Executed with Price Improvement
- What it is: A measurement of the frequency of shares receiving better than
the quoted price on orders sent to the broker-dealer.
- How it’s calculated: For buy orders, shares that received price improvement
are those with a price below the National Best Offer; for sell orders, shares that received price
improvement are those with a price above the National Best Bid. The sum of shares that received price
improvement is divided by the sum of all executed shares from the same orders.
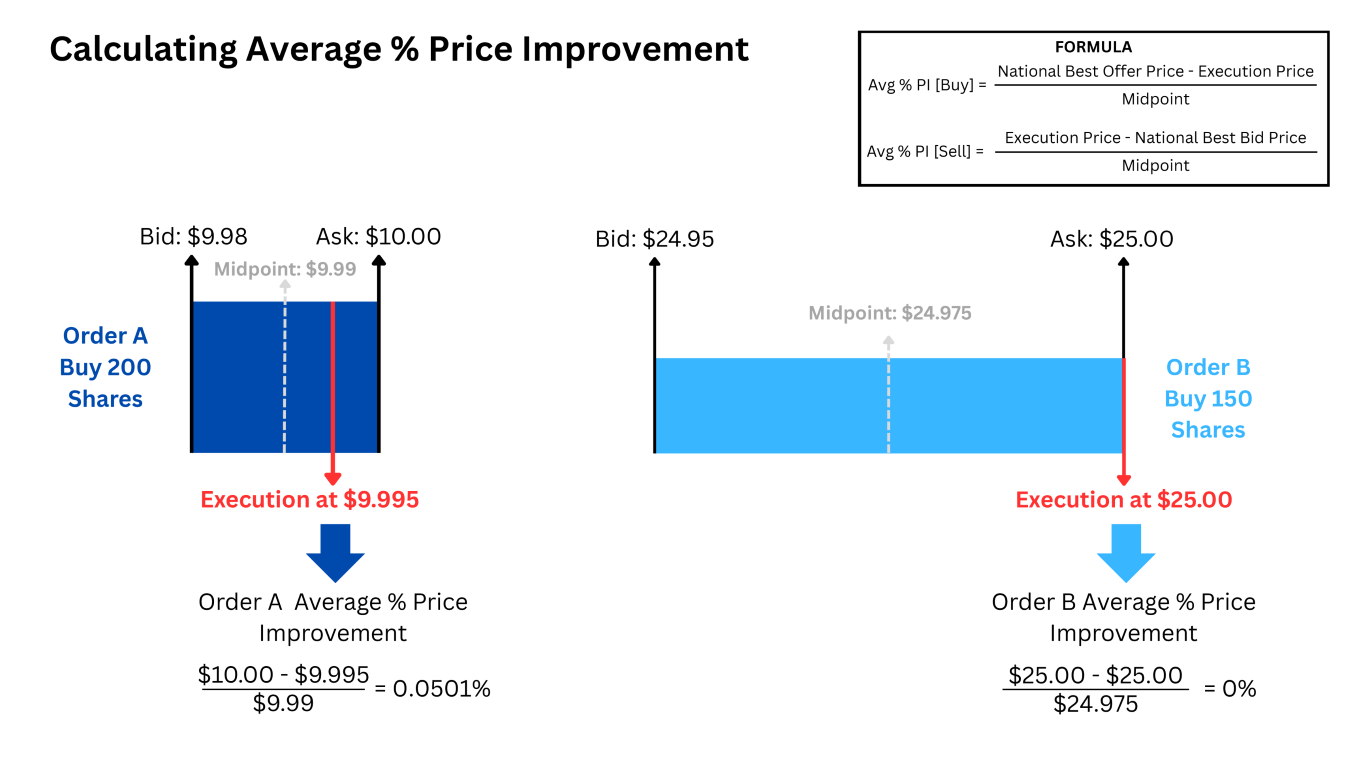
Share-weighted Average % Price Improvement
- What it is: A measurement of the average per-share amount of price
improvement relative to the share price on orders sent to the broker-dealer.
- How it’s calculated: First, calculate the share-weighted average price
improvement. For buys, price improvement is the difference between the National Best Offer and the order’s
execution price; for sells price improvement is the difference between the order’s execution price and the
National Best Bid. The share-weighted average price improvement is divided by the share-weighted average
midpoint for such orders.
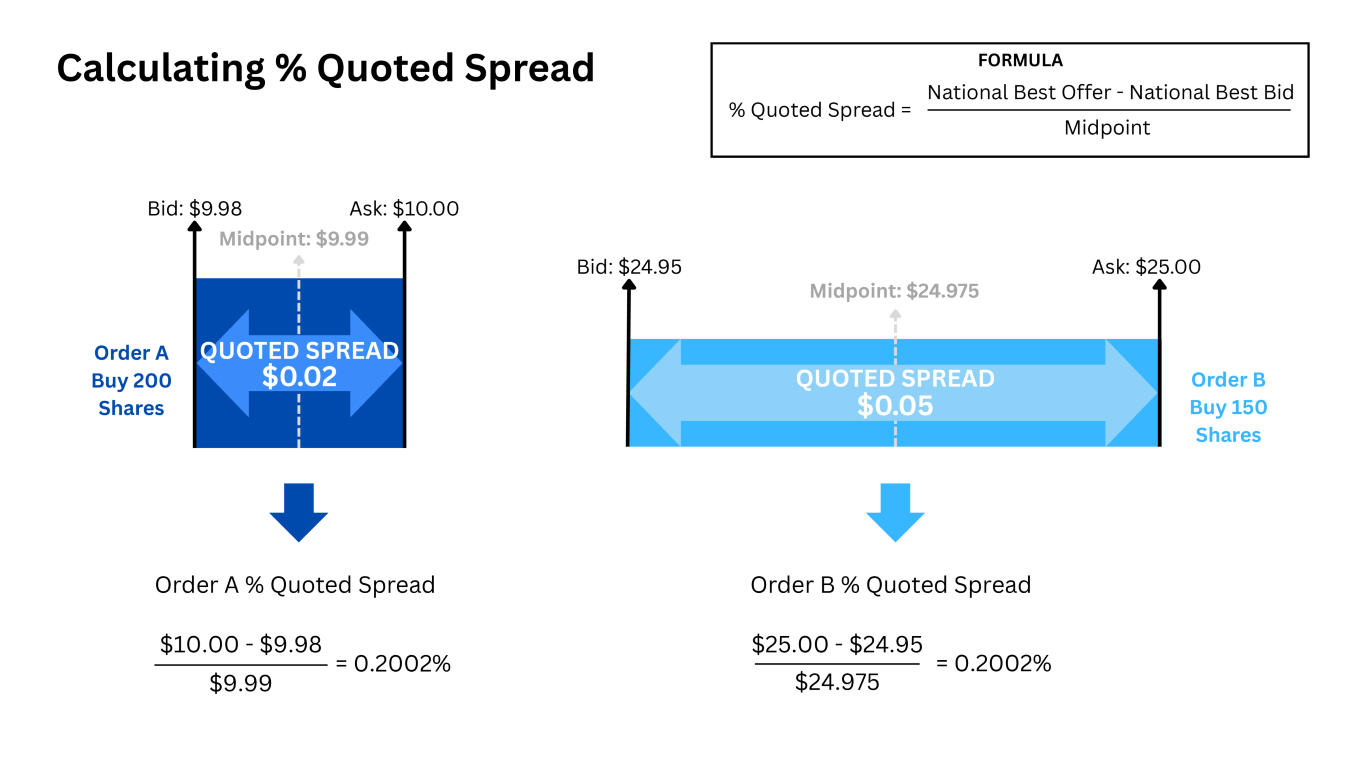
Average % Quoted Spread
- What it is: A measurement of the average anticipated per-share cost of
trading—exclusive of broker fees—relative to the share price on orders sent to the broker-dealer.
- How it’s calculated: First, calculate the share-weighted quoted spread.
Quoted spread is the difference between the National Best Offer and the National Best Bid. Share-weighted
average quoted spread is divided by the share-weighted average midpoint.
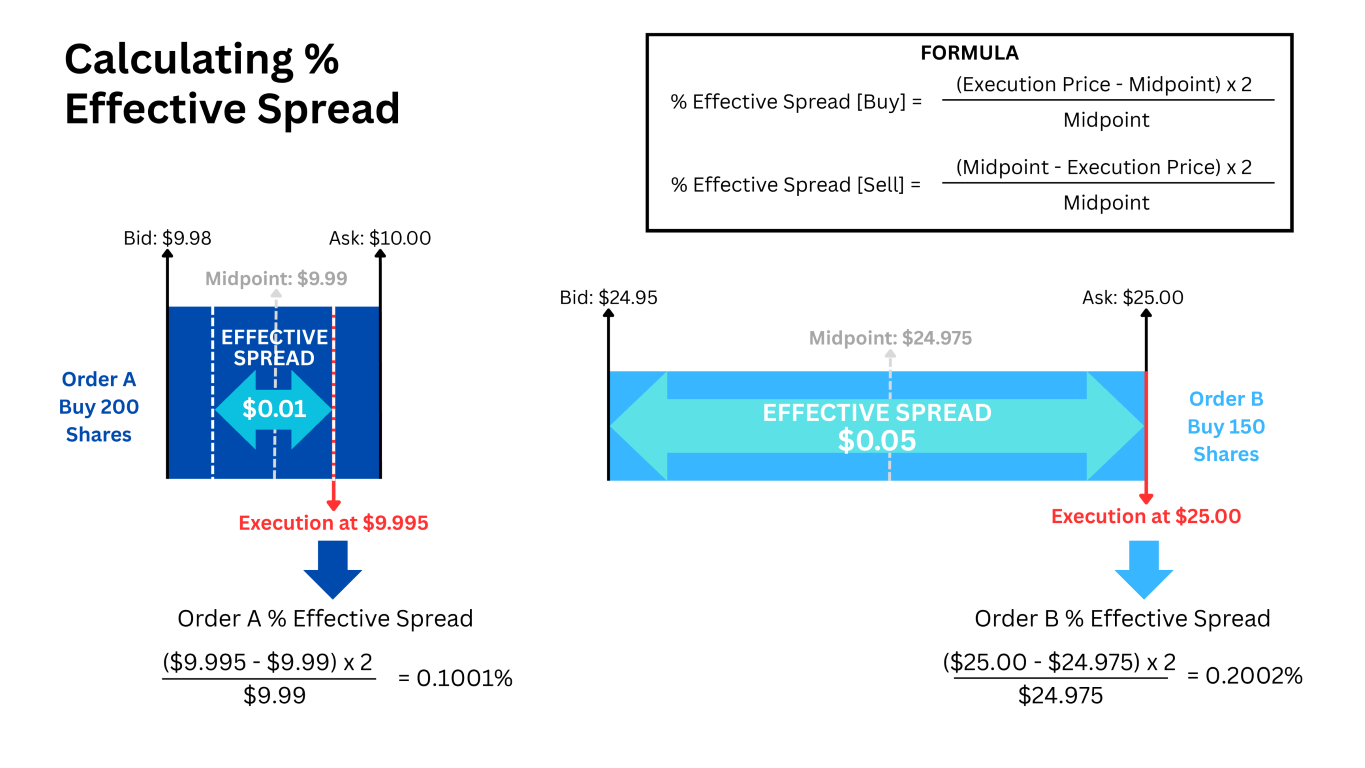
Average % Effective Spread
- What it is: A measurement of the average actual per-share cost of
trading—exclusive of broker fees—relative to the share price on orders sent to the broker-dealer.
- How it’s calculated: First, calculate the share-weighted average effective
spread. For buys, effective spread is two times the difference between the execution price and the midpoint;
for sells, effective spread is two times the difference between the midpoint and the execution price.
Share-weighted average effective spread is divided by the share-weighted average midpoint for such orders.
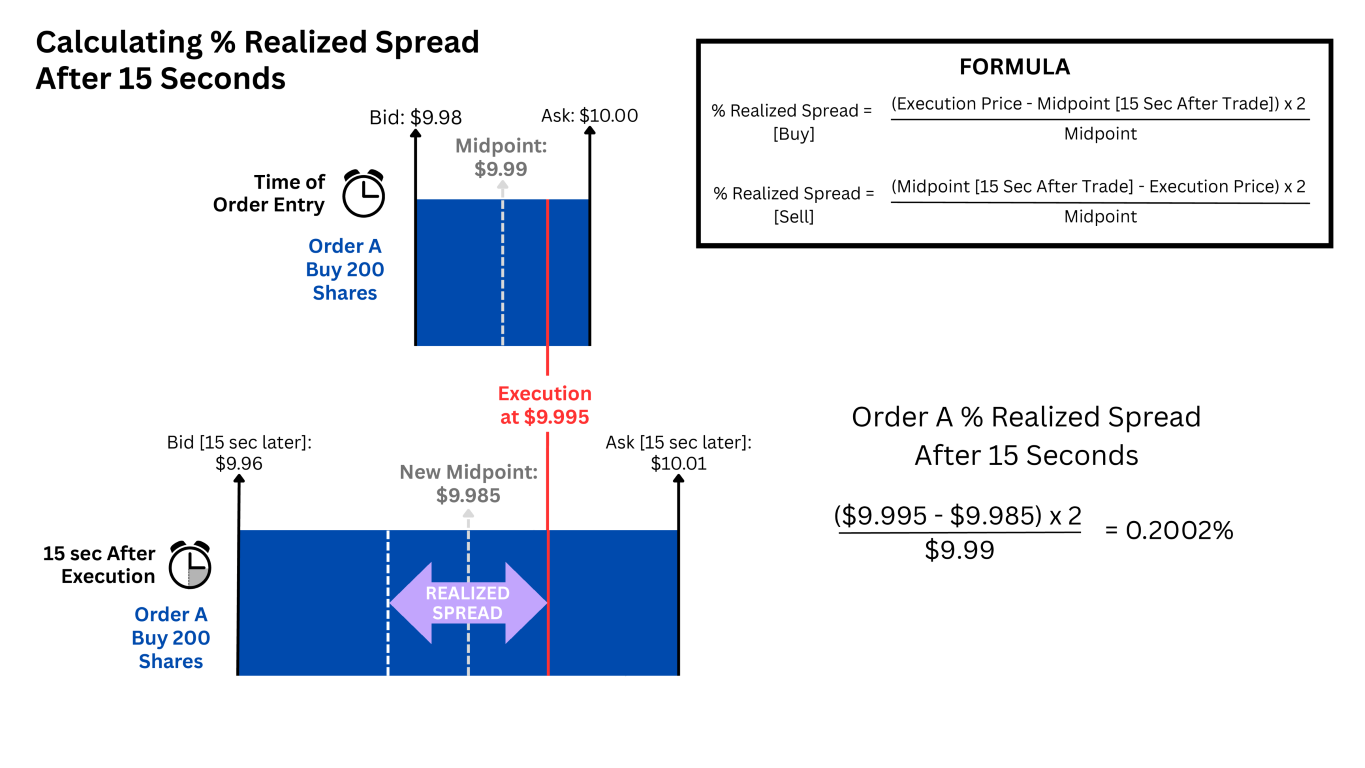
Average % Realized Spread After 15 Seconds
- What it is: A measurement of the average per-share cost of trading—net of
post-trade price changes and exclusive of broker fees—relative to the share price on orders sent to the
broker-dealer.
- How it’s calculated: First, calculate share-weighted realized spread. For
buy orders, realized spread is calculated as double the amount of difference between the execution price and
the midpoint of the national best bid and offer 15 seconds after the time of order execution. For sell
orders, realized spread is calculated as double the amount of difference between the midpoint of the
national best bid and offer 15 seconds after the time of order execution and the execution price.
Share-weighted realized spread is divided by the share-weighted average midpoint for such orders.
Average % Realized Spread After 1 Minute
- What it is: A measurement of the average per-share cost of trading—net of
post-trade price changes and exclusive of broker fees—relative to the share price on orders sent to the
broker-dealer.
- How it’s calculated: First, calculate share-weighted realized spread. For
buy orders, realized spread is calculated as double the amount of difference between the execution price and
the midpoint of the national best bid and offer 1 minute after the time of order execution. For sell orders,
realized spread is calculated as double the amount of difference between the midpoint of the national best
bid and offer 1 minute after the time of order execution and the execution price. Share-weighted realized
spread is divided by the share-weighted average midpoint for such orders.
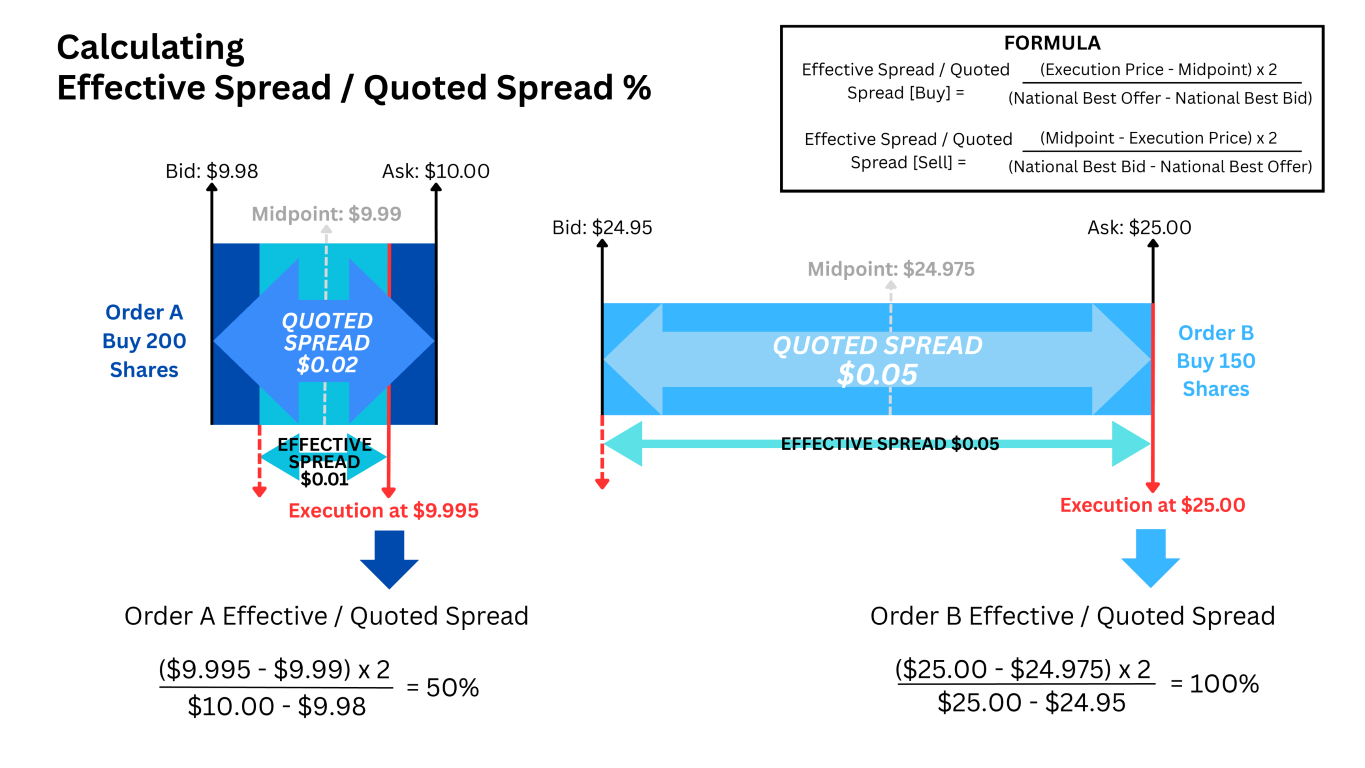
Average Effective Spread / Average Quoted Spread %
- What it is: A measurement of the average cost of trading—exclusive of
broker fees—relative to the quoted spread on orders sent to the broker-dealer.
- How it’s calculated: First, calculate the share-weighted average effective
spread. For buys, effective spread is two times the difference between the execution price and the midpoint;
for sells, effective spread is two times the difference between the midpoint and the execution price.
Second, calculate the share-weighted quoted spread. Quoted spread is the difference between the National
Best Offer and the National Best Bid. Share-weighted effective spread is divided by the share-weighted
quoted spread, expressed as a percentage.
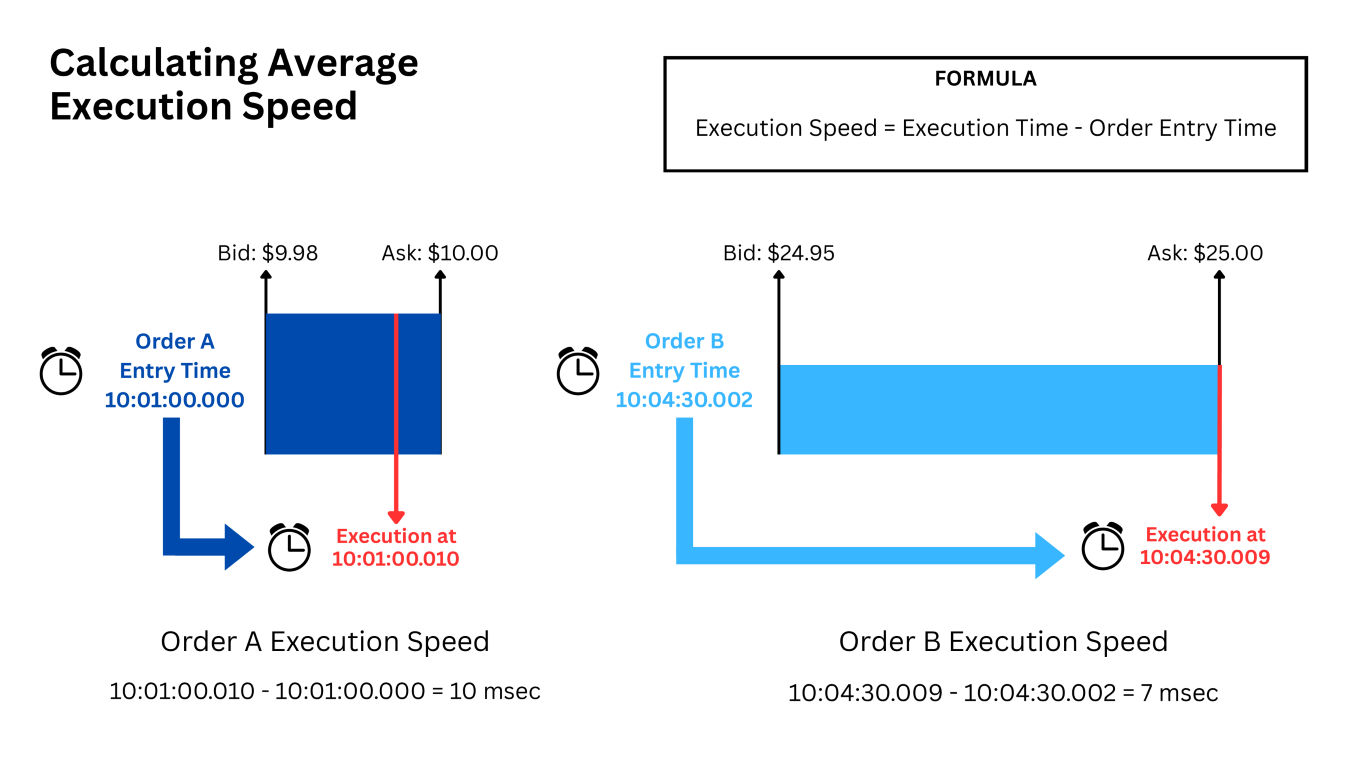
Share-weighted Average Execution Speed
- What it is: A measurement of the average time between when shares were
ordered and executed on orders sent to the broker-dealer.
- How it’s calculated: Execution speed is the share-weighted difference
between the execution time and order entry time, expressed in milliseconds.
↑